4th Quarter Trends Maps:
How to read maps:
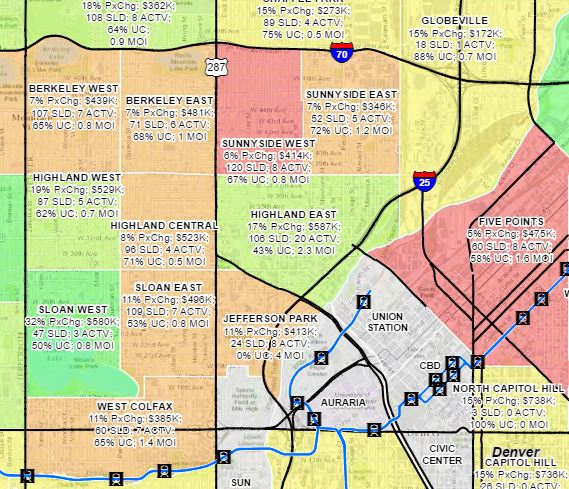
Each neighborhood lists the name, percentage of value change over the past year, average sales price, the number sold in the past year, the number active for sale, the percent of properties for sale that are under contract (pending), the months of inventory.
If the MOI is 6 months, it is a balanced market. If its more than 6 months, it is considered a buyer’s market and if its less than 6 months, it is a seller’s market. The lower the number the stronger the market is for sellers.
The percentage of change over the past year is a good indicator of how the area has fared. The months of inventory is a future indicator of which direction the area is headed, up or down. If there are less than 6 months of inventory is is likely values will continue upwards.
For any additional questions please call me! Monica 303-912-3320